
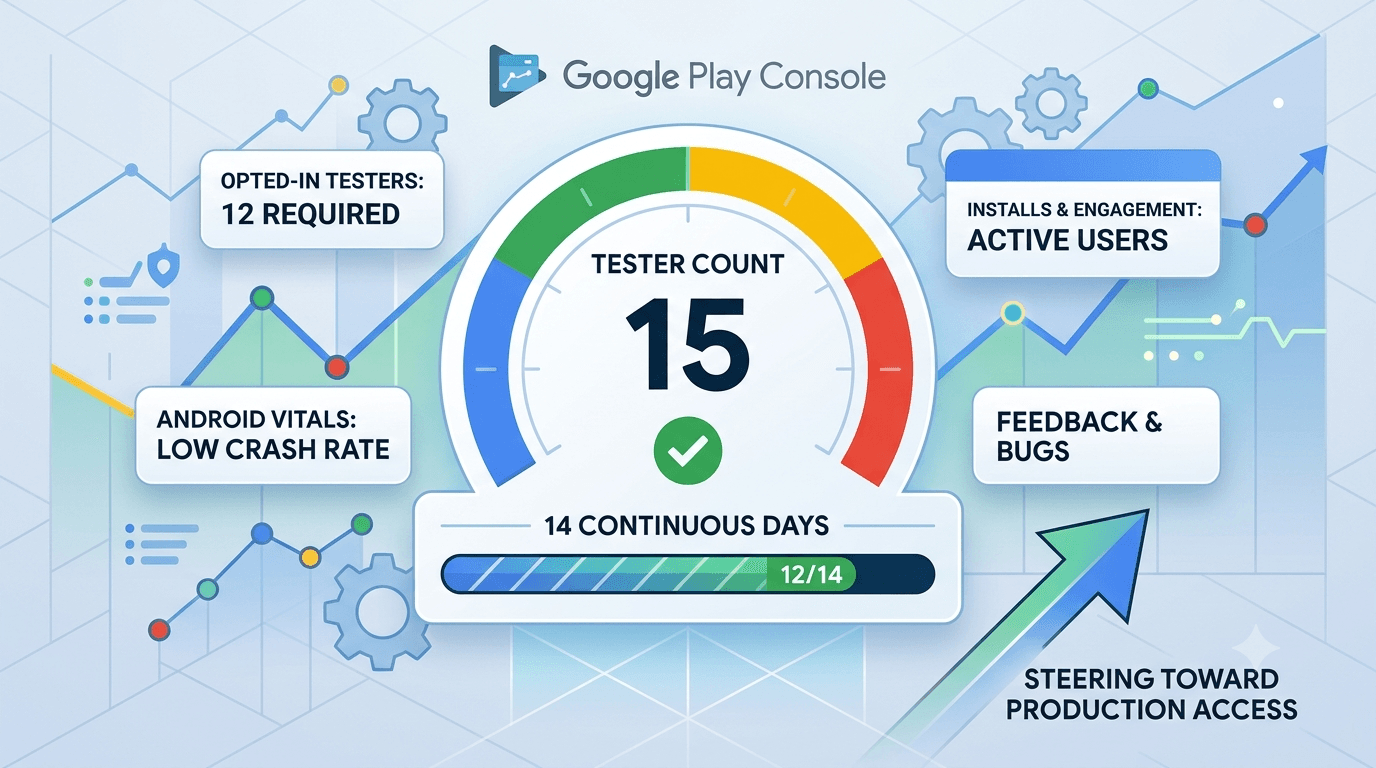
During your closed test, the Google Play Console shows a range of dashboards and metrics, and knowing how to read them is the difference between anxiously guessing whether you are on track and confidently steering toward production access. The most important figures tell you whether you have enough active testers for the required duration; others reveal your app's stability and your testers' engagement. Because any app from a new personal account must complete a closed test with at least 12 testers opted in for 14 continuous days before production access, understanding these metrics is essential to actually meeting the requirement. This guide explains the closed-testing dashboard metrics and what to do with them.
The closed-testing process is the same for everyone, but developers who read their dashboards act early on problems — a dropping tester count, a rising crash rate — instead of discovering them too late. Using the metrics well turns the window from a black box into a controllable process.
The metrics that define the requirement
The requirement is specific: at least 12 testers opted in, active for 14 continuous days. So the metrics that matter most are your count of opted-in testers and the continuity of that count over time. See the closed testing guide. The Console shows how many testers have opted into your test, and this is the number you must keep at or above 12 throughout the period. If it dips below, you risk resetting or extending your clock, which is why watching it daily matters.
Standard advice applies: recruit committed, device-diverse testers, keep your count above 12 with a buffer, and prepare your listing in parallel. The dashboards are how you verify, day by day, that you are actually satisfying the requirement rather than assuming you are.
Reading your tester count
Your opted-in tester count is the headline metric, but read it carefully: it reflects testers who have accepted your invitation and are eligible, which is not always the same as testers actively using the app. A tester can opt in and then never install or engage, so a count of exactly 12 with a few disengaged testers is precarious. This is why recruiting a buffer — say 15 to 20 — matters: it keeps your effective active count safely above the 12 threshold even if some testers drift. Check this number daily and react if it trends down.
Because the requirement is about continuous participation over 14 days, a mid-window drop below 12 is the failure mode to guard against. If you see your count slipping, recruit and onboard replacements immediately rather than waiting, since a new tester needs time to opt in and count. Treating the tester count as a live gauge you actively manage, not a number you check once, is what keeps your 14-day clock running cleanly. See keeping testers engaged.
The dashboards at a glance
Beyond the tester count, the Console surfaces several dashboards worth understanding during your test.
| Metric / dashboard | What it tells you |
|---|---|
| Opted-in testers | Whether you meet the 12-tester threshold |
| Days elapsed | Progress through the 14-day window |
| Crashes & ANRs (vitals) | Stability issues to fix before production |
| Installs / active devices | Whether testers actually engaged |
| Pre-launch report | Automated device-lab findings |
Together these tell you both whether you will meet the requirement and whether your app is actually ready. See pre-launch report vs closed testing.
Stability metrics and Android vitals
Meeting the tester requirement gets you eligible for production, but you also want to arrive there with a stable app, which is where Android vitals during your test comes in. Vitals reports crash rate and ANR (application not responding) rate aggregated from your testers' real usage, along with other stability and performance signals. A high crash or ANR rate during closed testing is a warning you should heed before promoting to production, since these same problems would hit real users at scale. Investigate and fix the top crashes your testers surface.
Reading vitals means looking at rates and the specific crash clusters, not just a single number: identify which crashes affect the most sessions or devices, prioritize those, and confirm your fixes reduce the rate in subsequent builds. Because your testers generate this data through genuine use, it is a realistic preview of your production stability. Using the window to drive your crash and ANR rates down is one of the highest-value things the dashboards enable. See fixing crashes before production.
Engagement and install signals
Install and active-device figures tell you whether your testers are genuinely participating or merely opted in on paper. If many testers opted in but few installed or the app sees little usage, your test is weaker than the headline count suggests, and you may also be at risk if Google's systems weigh genuine activity. Low engagement is a signal to re-energize your testers with clearer instructions, tasks, or communication, and to consider whether you recruited committed testers or passive ones. See how Google detects fake testers.
Healthy engagement — testers installing, opening the app, and using it over the window — both strengthens your requirement compliance and produces the real feedback and vitals data that make the test worthwhile. If your engagement metrics are weak, address the cause rather than ignoring it, because genuine participation is what the requirement is ultimately about. See real testers vs fake testers.
Recruiting to keep your metrics healthy
Your metrics are only as good as your tester group, so recruit 12+ committed, device-diverse testers with a buffer, keep them engaged, and replace any who drop early. Watching your dashboards tells you when to act; a healthy, engaged group is what makes the numbers look right. Monitor your active count and vitals throughout, and respond to any negative trend promptly.
If assembling and sustaining that engaged group is your bottleneck, a service that supplies verified real testers keeps your tester count and engagement metrics healthy throughout the window. You can submit your app to get started, and read where to find real testers.
Making the metrics work for you
Because the requirement forces you to run the test anyway, use the dashboards to run it well rather than blindly. Check your tester count and days elapsed daily to ensure the clock keeps running, drive down crash and ANR rates using vitals, and address weak engagement before it undermines you. A well-monitored window means you reach the end of 14 days both compliant with the requirement and confident your app is stable.
Enter production having watched your metrics turn green — a sustained tester count, low crash rate, genuine engagement — and you launch on evidence rather than hope. The dashboards are the instrument panel that turns the mandatory window into a controlled approach to launch. See what happens after 14 days.
Combining metrics with tester feedback
Metrics tell you what is happening; tester feedback tells you why. A rising crash rate in vitals plus a tester's report of the exact steps that broke the app gives you a fixable bug; an engagement dip plus feedback about a confusing onboarding tells you what to improve. Give testers an easy way to report issues and pair their qualitative reports with the quantitative dashboards for a complete picture. Then fix, redeploy, and watch the metrics confirm your improvements.
This loop — read metrics, gather feedback, fix, verify — is how the window produces a genuinely better app rather than just a satisfied requirement. An app that enters production having closed this loop repeatedly is far more robust than one whose developer only watched the tester count. See updating mid-testing.
Metrics on internal testing too
The internal testing track offers similar visibility faster, so use it for a first pass before your counted closed-testing window. Upload there, review the pre-launch report and early vitals, and fix obvious issues before your 14-day clock starts. This means your closed-testing metrics start from a cleaner baseline, and your window is spent refining rather than discovering basic crashes. Watching metrics across both tracks gives you the earliest possible warning of problems. See internal vs closed testing.
By staging on internal first, the metrics you watch during your counted window reflect a more mature build, making them easier to interpret and act on. See the Play Console beginner guide.
After launch: metrics keep guiding you
Your closed-testing dashboards give way to production metrics after launch, but the habit of reading them carries over. Android vitals continues reporting crashes, ANRs, and performance from your full user base; your listing and acquisition metrics show how you are growing; and reviews provide qualitative signal. Keep watching these the way you watched your closed-testing dashboards, and act on negative trends early. An app whose developer keeps reading the metrics stays healthy and improves; one that stops watching after launch flies blind. See post-launch monitoring.
Understanding the continuity requirement
The word "continuous" in the 14-day requirement is what the dashboards ultimately help you protect. The clock is not simply "14 days from when you started"; it is about sustaining at least 12 opted-in testers across a continuous period, and letting your count lapse can interrupt or reset that progress. This is why a single daily glance at your tester count is not paranoia but prudence — a drop you catch on day two is easily fixed, while one you notice on day twelve may cost you days you cannot recover. The dashboards make continuity visible so you can defend it.
Practically, this means treating your buffer as insurance against the inevitable drift: some testers will uninstall, go quiet, or lose interest, and only a cushion above 12 keeps your effective count safely in requirement territory throughout. If the Console shows your count trending toward the threshold, act that day. Reading the dashboards with the continuity requirement in mind turns them from a status display into an early-warning system for the one thing that can quietly derail your launch. See keeping testers engaged.
Metrics developers commonly misread
A few metrics are easy to misinterpret. A healthy opted-in count can mask low real engagement, so do not celebrate 15 opted-in testers if only 4 actually use the app. A low crash count early can be misleading if few testers have installed yet — rates matter more than raw counts, and they stabilize as usage grows. And a clean pre-launch report can create false confidence, since it reflects automated crawling, not the human validation the requirement is about. Reading each metric for what it actually measures prevents comfortable but wrong conclusions.
The antidote is to look at the metrics together rather than fixating on one. A strong test shows a sustained tester count, genuine install and engagement activity, a falling crash and ANR rate, and corroborating tester feedback. When those align, you can trust that you are both meeting the requirement and building a stable app; when they conflict, the discrepancy tells you where to dig. Interpreting the dashboards holistically is what separates confident developers from anxious ones. See how Google detects fake testers.
Key takeaways
- Watch your opted-in tester count daily — keep it above 12 with a buffer.
- The requirement is 12 testers for 14 continuous days — continuity matters.
- Use Android vitals to drive down crash and ANR rates before production.
- Check engagement signals — opted-in is not the same as active.
- Pair metrics with tester feedback to fix the right things.
Frequently asked questions
What is the most important closed-testing metric?
Your count of opted-in testers, which must stay at or above 12 for the full 14 continuous days. Watch it daily.
Does opted-in mean the tester is active?
Not necessarily. A tester can opt in without installing or using the app, so also watch install and engagement signals and keep a buffer above 12.
What crash rate is acceptable before production?
Lower is better; use Android vitals to identify and fix your top crashes and ANRs during the window rather than carrying them into production.
What happens if my tester count drops below 12?
You risk extending or resetting your continuous window, so recruit and onboard replacements immediately if you see the count slipping.
Where do I see stability metrics during testing?
In Android vitals and the pre-launch report within the Play Console, both populated by your testers' usage and Google's device lab.
Should I use internal testing to pre-clean metrics?
Yes. Fix obvious issues on the internal track first so your counted window's metrics start from a cleaner baseline.
How do metrics and feedback work together?
Metrics show what is happening; tester feedback explains why. Combine them to prioritize and verify the fixes that matter most.
Expanded for topical authority — additional practical sections below. Original guide content above is unchanged.
Quick answer
Google Play Closed Testing Dashboard Metrics Explained matters because Google Play production access for many new personal developer accounts depends on a successful closed test: at least 12 real testers opted in for 14 continuous days, plus a policy-compliant, stable app. Use this guide to execute the steps correctly, avoid streak-breaking mistakes, and decide whether DIY recruitment or a managed closed testing service is the better path for your deadline.
Real-world scenarios: who this matters for
The guidance in this article on Google Play Closed Testing Dashboard Metrics Explained applies across many Android product types. Use these scenarios to map the advice to your situation.
| Developer type | Typical challenge | Practical focus |
|---|---|---|
| Indie / solo | Limited tester network and time | Start closed testing early; keep a buffer above 12 opted-in testers; parallelize listing + Data safety work |
| Startup | Launch deadline vs 14-day rule | Treat the window as fixed; recruit in parallel with QA; avoid last-minute track setup |
| Agency / white-label | Multiple client apps, each needing its own test | One closed test per app; standardize opt-in onboarding; track eligibility dates per client |
| Flutter / React Native | Cross-platform build + Play Console quirks | Ship a signed AAB to closed testing; verify installs from Play, not sideload; watch vitals on mid-range devices |
| Native Kotlin | Device/API fragmentation | Cover API levels and OEMs in your tester mix; fix crashes before requesting production |
| Game / Unity | Performance + retention during 14 days | Keep testers engaged so count never dips below 12; monitor ANRs and battery |
| E-commerce / fintech | Policy + payment flows | Test checkout, permissions, and declarations carefully before production access |
| Healthcare / kids / education | Sensitive policies (Families, data) | Align listing, privacy, and content rating with real app behavior during the test window |
Visual placeholder: Scenario matrix infographic — Indie / Startup / Agency / Cross-platform paths for Google Play Closed Testing Dashboard Metrics Explained.
Comparison: DIY recruitment vs managed closed testing
When your goal is Google Play production access, the path you choose for testers affects time, risk, and feedback quality. Use this comparison while deciding how to apply Google Play Closed Testing Dashboard Metrics Explained.
| Approach | Time to 12 opted-in | Cost | Dropout risk | Feedback quality | Best when |
|---|---|---|---|---|---|
| Friends & family | Days–weeks | $0 | High | Mixed | Tiny MVP, flexible timeline |
| Reddit / Discord / Telegram | Unpredictable | $0–low | High | Variable | You can manage onboarding daily |
| Peer community exchange | Variable | $0 | Medium | Developer-biased | You can test others’ apps in return |
| Managed closed testing (e.g. Fast Testers) | ~1 hour after valid link | $15 one-time / app | Low (buffer of 15) | Real Play installs | You need speed + continuity for 14 days |
Decision tip: If a broken streak would delay revenue or a client deadline, prioritize reliability over $0 recruitment. DIY is fine when you already have engaged testers and can monitor Play Console daily.
Visual placeholder: Comparison diagram — DIY vs community vs managed testing for Google Play Closed Testing Dashboard Metrics Explained.
Common mistakes (and how to avoid them)
These mistakes repeatedly show up when developers work through Google Play Closed Testing Dashboard Metrics Explained:
- Confusing invited vs opted-in testers — Only testers who open the opt-in link and install from Play count toward 12. Check the opted-in number in Play Console, not your email list.
- Recruiting exactly 12 with no buffer — One uninstall can break continuity. Aim for ~15 active opted-in testers.
- Starting the counted clock late — Listing assets, Data safety, and privacy work should run during the 14 days, not after.
- Using sideloaded APKs or fake installs — They do not satisfy Play’s closed testing expectations and can create account risk.
- Ignoring tester feedback until day 14 — Crashes that drive uninstalls threaten your streak and your review outcome.
- Requesting production access before the continuous streak completes — Eligibility checks fail even if calendar time has passed.
Troubleshooting checklist
If something feels “stuck” while applying Google Play Closed Testing Dashboard Metrics Explained, walk this list before changing strategy:
| Symptom | Likely cause | Fix |
|---|---|---|
| Console shows < 12 testers | Invites sent but not opted in | Resend opt-in link; confirm install from Play |
| “Not eligible” after 14 calendar days | Count dipped below 12 mid-window | Restore 12+ and complete a full continuous streak |
| Tester cannot join | Wrong account, Group lag, or track not published | Verify Google account, Group membership, track release |
| App fails to install | Device/API mismatch or signing issue | Check AAB, minSDK, Play App Signing |
| Production still rejected after testing | Policy, declarations, or stability — not the clock | Read the exact reason; fix that category completely |
Visual placeholder: Troubleshooting flowchart for Google Play Closed Testing Dashboard Metrics Explained.
Action checklist
Use this checklist alongside the rest of this guide on Google Play Closed Testing Dashboard Metrics Explained:
- ☐ Closed testing track created with a signed release (AAB)
- ☐ Opt-in link tested on a fresh Google account
- ☐ At least 12 testers opted in (prefer ~15)
- ☐ Daily check that opted-in count stays ≥ 12 for 14 continuous days
- ☐ Core flows exercised (login, main feature, permissions, offline/online)
- ☐ Crashes / ANRs triaged from tester reports and vitals
- ☐ Store listing, screenshots, and feature graphic drafted
- ☐ Privacy policy + Data safety + content rating aligned with real behavior
- ☐ Production access requested only after eligibility is green
- ☐ Staged rollout plan ready for first public release
Additional FAQs developers ask about Google Play Closed Testing Dashboard Metrics Explained
Quick answer: what should I do first?
Confirm you are on a closed testing track with real opted-in installs, keep 12+ testers for 14 continuous days, and fix policy/stability issues in parallel. Then use the detailed sections above for Google Play Closed Testing Dashboard Metrics Explained.
Does this apply to organization (company) accounts?
The classic 12×14 closed testing gate is primarily associated with new personal developer accounts. Always verify your account type and current Play Console eligibility messaging for your app.
Do friends and family count as testers?
Yes — if they opt in via your closed testing link and install from Google Play. They only help if they stay opted in for the continuous period.
Can I update the app during the 14 days?
You can usually push updates on the closed track, but unstable releases that cause uninstalls can threaten your tester count. Prefer polishing via internal testing first when possible.
What if production access is still rejected?
Read the exact reason. Incomplete testing is only one category — policy, Data safety mismatches, and crashes are common. Fix the cited issue fully before reapplying.
Is paying for testers allowed?
Using real people who install from Play is what matters. Avoid fake install farms. A one-time managed service that supplies real closed testers is a practical option when DIY recruitment is too slow.
How is Fast Testers different from free communities?
Free communities trade time and mutual availability. Fast Testers assigns about 15 real testers after you submit a valid closed testing link (one-time $15 per app) and includes a production access guarantee under its refund terms.
Where should I go next?
Review the related guides below, then either finish DIY recruitment or start closed testing if you need speed and continuity.
Sources, updates, and how to use this guide
This article on Google Play Closed Testing Dashboard Metrics Explained is maintained for Android developers preparing Google Play closed testing and production access. Always cross-check eligibility text inside your own Play Console, because Google’s UI labels and account rules can vary by account type and date.
- Primary official references: Google Play closed testing help, Developer Program Policies, and Play Console eligibility messaging for your app.
- Practical experience lens: guidance here reflects common failure modes indie developers and agencies hit when recruiting testers, maintaining the 14-day streak, and recovering from production-access rejections.
- Last reviewed focus: 12×14 closed testing continuity, real vs fake testers, and parallel listing/compliance work during the window.
Related guides and next steps
Continue building topical depth around Google Play Closed Testing Dashboard Metrics Explained with these Fast Testers resources:
- Closed Testing Vs Open Testing On Google Play
- Google Play Internal Testing Vs Closed Testing
- Common Google Play Closed Testing Mistakes
- Google Play Android Vitals During Closed Testing
- Google Play Closed Testing
- Google Play Closed Testing Email Templates For Testers
- Google Play Closed Testing Faq 50 Answers
- Google Play Closed Testing For Flutter Apps
- Pricing — $15 closed testing
- How Fast Testers works
- FAQ
- Developer reviews
- Case studies
- Submit your app / start closed testing
Need reliable testers so your 14-day streak does not stall? Educate first with the guides above, then start when you are ready — one-time pricing, real Play installs, dashboard tracking.
Internal navigation hub — added to strengthen topical connections. Original article content above is unchanged.
Continue learning
- Common Google Play Closed Testing Mistakes to Avoid — The most common Google Play closed testing mistakes — wrong track, too few testers, dropouts, sideloading — an.
- Google Play Android Vitals During Closed Testing — Learn about vitals monitoring for Google Play closed testing. Complete guide for Android developers publishing.
- Google Play Closed Testing Complete Guide — A comprehensive walkthrough of the entire closed testing process..
- Google Play Closed Testing Email Templates for Testers — Learn about tester communication for Google Play closed testing. Complete guide for Android developers publish.
- Google Play Closed Testing FAQ: 50 Answers — Learn about comprehensive FAQ for Google Play closed testing. Complete guide for Android developers publishing.
- Google Play Closed Testing for Flutter Apps — Learn about Flutter app testing for Google Play closed testing. Complete guide for Android developers publishi.
Next steps
- Ready to run closed testing with real Android testers? Submit your app or see pricing ($15 one-time).
- Compare options on our testing service comparison page, or read developer reviews and case studies.
- Still deciding? Review how Fast Testers works and the FAQ.